This is the third in a series of articles made in collaboration with the Chicago Arts Census to explore the living, labor, and material realities of art workers in the city of Chicago. Please visit the Chicago Arts Census website to learn more about the Census, how to get involved, and to take the survey.
How do I remain invisible to the archive? Can I tread lightly enough as I pass through it so as not to disturb its contents or their present (dis)order?
Sourcing materials activates archives. The act of researching and referencing breathes life into objects in stasis. Calling collections as encantations. Speaking, singing the archive… I think I want to whisper into it.
Am I myself a haunt within the archive? Or am I haunted by its contents and implications?
If I am in the business of animating archives and I want to create systems for re/animating the archive’s contents… does my process (of research, synthesis, fabrication) constitute the creation of algorithms?
- This process entails acknowledging the subjective position of those collecting, organizing, narrativizing the data… and then reconnecting those processes to the lived realities they reference.
- It also entails recognizing the artist as algorithm–complete with inherent biases, agendas, proclivities, and aesthetic sensibilities.
- As algorithm, I perform the work of the researcher, data miner, fabulist. The information passes through systems (I construct) and presents stories I
want totell.
How do I reconcile my critique and mistrust in algorithms (with all their inherent systemic biases) with the aspiration to function as an algorithm myself?
How do I perform (in the service of, as violence to, as cipher for) the archive?
As conduit between archives, I endeavor to provide a(n invisible) bridge between data, between meta categories, linking narratives–open, as a tableau, upon which they might mingle and form new connections–and meanwhile, leave no trace. Can I perform as medium, as milieu, connective tissue, undetected?
How do Why must I remain invisible to the archive? I remain unseen, mispronounced, misquoted, discarded, untended, corrupted, missing metadata and thereby undiscoverable.
If my provenance is truncated and I am forever absent verifiable primary source material (e.g. recorded family lineage) as my proof of existence, how can I be valid, how can I be credible?

Within a web of Linked Open Data, can my hyper-relation to disparate (and ultimately unrelated, in my mind) topics diminish my findability? I am omitted from finding aids.
Discard: contents aporetic
Do I aspire to Archon status (gatekeeper, caretaker) in relation to the archive ? No. If anything, I am inviting everyone in. Public librarians are also social workers. Consider who frequents the public libraries in this city, what resources we seek (knowledge, internet access, community, warmth, refuge, public toilets).
I wonder who witnesses and who records what is said in hush arbors? Who safeguards those records? And who is granted access to them?
Text threads amongst community organizers (read: activists, anti-fascists, anarchists, anti-capitalists, all those who openly critique systems of power and oppression) are invaluable archives of and testament to the beautiful messiness of collaboration and vision work. How can we preserve these histories (while protecting those who speak (out))? How can this work — these conversations, collaborations, actions — be documented and fully validated if it is impossible to credit those doing the work? if it is impossible to give a full account? if it is impossible to properly cite the source? Protect the source, compromise credibility. Protect the witness, abstract the voice of the testimony.
It is admittedly with great difficulty that I am writing this, this text on research in archives, humanizing data collection + representation. My practice intends to humanize data visualization, by generating compassionate associations with the communities who are subject(ed) to those data and the ramifications of their narrativization. I am troubled by the fact that despite the archive’s refusal to see me, I cannot not (help but) recognize my own hand (biases, narratives, experience) in my efforts to animate it.
I work primarily with found materials. Found objects arrive to my studio world-weary and ripe with their own histories, use values, associations, past lives… they have their own agendas and communicate their (dis)interest in engaging in collaborative formation of (new) meanings. Found text (mis)appropriated, (mis)translated, re/de-contextualized, weaponized… (The Author is not Dead). Texts point back to the author/s (see: Debord On the Subject of Stolen Films).

I work with found data. Found data — what does that even mean? Data visualizations, data sets, point back to the object/s of study… they point to various phenomena, and not to the collectors or presenters of those phenomena. “The data tell a story.” “They are self-animated.” They are presented as objective proof, for the purpose of validating others’ stories.
Working with found data considers the provenance of data sets, the methodology used in collection, the primary agendas of the researchers and authors in animating the data, what larger stories (historical political agendas, pop cultural trends, global issues, social values…) informed these processes? And what other narratives have these data and those authors supported?
The Author is [not] Dead. Everything is said in every era. What is not said also reflects the values of that era. What is not documented (digitized, findable) by the dominant culture reflects the values of that era.
I have always made work with found materials (recycled paper, already printed-on, fabric scraps, miscellaneous detritus from the alleyway), found texts (borrowed prose, redrawn news briefs, hand-copied executive memos), found data (Census, NASDAQ, IPUMS, Farmers Almanac…). I reconsider the notion of “found.” Etymologically, “to find” means to retrieve something lost, but also to be situated, to deem something so, for something to be the case that… suggesting a search for, a study of, and a determination or judgment concluded. The task of finding is subjective, situational, and personal. When we think about found object artworks, there’s often this assumption of objectivity both on the part of the artist and the object/s “discovered.” The artist, in all his genius, happened upon materials that spoke to him. The artist made these materials speak for him. Perhaps a decolonialized strategy for working with found objects entails acknowledging that the task of finding is in itself deeply personal, biased, and is bound up in the agendas of the person doing the searching in the first place.
I’ve always considered work with found objects one of negotiating with an inanimate interlocutor. Individual objects have their own lived histories, use values, presences, auras—they are already speaking and arrive with their own agendas. Working with findings entails negotiating and collaborating to form new meaning beyond what we could achieve independently.
I’ve not previously assessed the degree to which my own hand, intentions, agendas predetermine which objects I “find,” (findings include data, text, physical objects). Considering the implications of working with “found data,” (and considering the bias at play in animating the world of Big Data via algorithms functioning in the service of capitalism, the surveillance state, and created largely by a non-diverse tech industry fraught with allegations of sexism, racism, and homophobia) I cannot not acknowledge my own hand in selecting found materials.

I’ve always considered my work site-specific, in that the texts and objects found in a place or space are tied to those origins. Working with found data, from online sources, the site specificity is temporal, institutional, governmental, or sociopolitical, related to a particular study or cause.
My work exists in parasitic relationship to those archives: at once mining from the contents and building new archives out of the findings. What’s found, previously specific to those sites, is repurposed, resituated, and reanimated by way of new systems, new algorithms–my current curiosities and inquiries, and understanding of my positionality in relation to the subject/s researched.
The problematics of the current work — notes on a project currently underway:
Irenewe Wa: she speaks the regular way is a public artwork in production for installation at O’Hare Airport this summer. The work illustrates the shifting demographic of the area that encompasses what is now called Illinois, over a 200-year timespan (from colonization, settlement and ratification, up to 2040) via demographic data visualized as decade-by-decade scatter-dot charts. Each chart bubble (or “disc”) represents a percentage increase in immigration to the region by country of origin–with the exception of Black people migrating from the South, and Indigenous peoples staying in or returning to the region. Out of 650+ discs in this work, approximately 100 will be engraved with phrases contributed from Chicagoland community partners.
- In researching this work it became apparent much of the information we sought exists behind paywalls or is not yet digitized. For example, while it is possible to access contemporary immigration data (from DHS and the National Archives sites), historical datasets and digitized annual immigration yearbooks are only available on sites like JSTOR and HathiTrust, which require institutional affiliations for full access.
- The degree to which geopolitical agendas determined who was counted accurately, whose populations lacked detail accounting, and who was omitted outright, also became apparent. For example, nationalities listed under the heading “selected immigrant populations” vary by decade, charting the political/capital/security interests of the federal government. The degree to which people are accounted for, the degree to which we count at all, reflects the motive to know. We suspect there are more accurate counts for those countries not selected for the annual immigration publication. Their absence from reports is a literal de-valuation of human lives. Those (ac)counts are not relevant to the narrative.
- The Integrated Public Use Microdata Series (IPUMS) datasets we initially worked with included many statistics for immigrants-by-country–and also statistics for entire continents in the global south. My nine year old still takes great joy in dragging the government statisticians…referring to “The Country of Africa!” and the “People of the Atlantic Islands!” Such counts are indeed absurd. Our project historian sighed, “garbage in garbage out… what do we even do with this??”
- The Census records immigration from other countries into the US, to specific regions and states, and to cities and counties. It is much more complicated to account for interstate migration of newly-immigrated populations or specific ethnicities of people. The majority of Japanese Americans migrating to the Chicagoland area in mid-20th century (were) relocated from other parts of the US following the closure of internment camps after WWII. Our community partners in the Japanese American community here have stressed the importance of illustrating this accounting in the work. Although we’ve followed their guidance (Japanese Americans are highlighted in the 1950s rather than the 1970s, and the quote they are contributing reflects this internal, mass migration) we are left with lingering questions. Specifically: how do we account for the fact that assimilation and cultural erasure was critical to survival? How do we account for the complexities of racism and xenophobia? or that the pernicious, persistent, and ever-changing naming conventions associated with race/ethnicity in the Census confound attempts to accurately count migrant (non-white) people?
- Similarly, identifying im/migrant populations by race or ethnicity in Census data is messy due to missing information, un/misidentified people, missing/inaccurate descriptors, fear, the pressure to assimilate, biases informing undercounts. discard : contents aporetic. Not surprisingly, the Census has just reported findings that it seriously undercounted the number of Hispanic, Black and Native American residents. We remain invisible in these archives–unfathomable, ineffable, inadmissible. To admit the presence of us… to admit us… to admit, to count, to name is to acknowledge equivalence, humanity.
- In researching this work, we determined it would be most pertinent to represent the percent delta fluctuations in immigration by demographic rather than merely illustrating the raw number of immigrants from each country. On the one hand, these upticks in immigration evidence geopolitical shifts, resource inequities, and mass mobilization. On the other hand, the affect is to literally increase the visibility of smaller immigrant communities (e.g. Chicago has a “small but mighty” Estonian community, although the real number of Estonians is relatively small). And for many of these countries, that first major uptick also marked their first and continued tracked and published immigration metric. The recorded uptick also functions to reference an absence of recorded data from previous years.
- In compiling, cleaning, and prepping the data for our programmer, we found it impossible to not acknowledge and discuss our own agency, biases, and motives. Our small research team is composed of BIPOC and queer artists, historians, and programmers. We acknowledge our desire to account for the stateless (Rohingya), the contested (Palestinians), the besieged (Ukrainians), colonized (CHamoru of Guahan, Potawatomi, Mayan). We recognize we ourselves are often undocumented, unaccounted, and without traceable points of origin.

I am not trained as a data analyst, scientific researcher, demographer, geographer or otherwise. I am however enamored of the simplicity and the clarity data visualizations project. These illustrations seek to make our complexities, messiness, nonlinear and intersecting narratives fathomable, accountable, counted. My practice (and here I mean as a maker, mother, educator, citizen…) is inspired, quite simply, by an insatiable desire to know, to understand. As my interests are far flung (read: I am no specialist!) I am drawn to these tidy illustrations of complicated phenomena, despite myself, despite my apprehension for linear narratives and conclusive statements. I am admittedly seduced by their concision and authority. The wanting to know more leads back here, to this discussion… to contemplating the flaws and failures inherent to data collection, organization, and narrativization. The desire to dig deeper inevitably leads to critiquing the very materials I’d intended to source. In self-consciously delving into archives, discovering systems (for naming, organizing, describing, sharing) I am ever aware that my own motives determine what is found–that the discoveries, the findings, what is unearthed, made visible, become legible are bound to me, as system generator, as algorithm, as animator of data.
And, perhaps this apprehension should come as no surprise. I am overwhelmed by the experience of seeing myself in the archive (recognizing my hand, intentions, biases, motives). And simultaneously, I am overwhelmed by its refusal to see me. I move through, seeing, but unseen. Counting but unaccounted (for). A ghost in the archive.

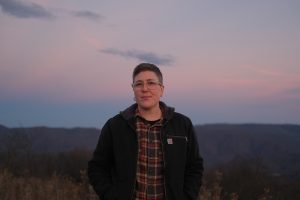
jina valentine is a mother, visual artist, and educator. Her independent practice is informed by traditional craft techniques and interweaves histories latent within found texts, objects, narratives, and spaces. jina’s work involves language translation, mining the contents of material and digital archives, and experimental strategies for humanizing data-visualization. She is also co-founder (with artist Heather Hart) of Black Lunch Table, an oral-history archiving project. Her work has received recognition and support from the Graham Foundation, Joan Mitchell Foundation and Art Matters, among others.


